
| University | University of Auckland (UOA) |
| Subject | ENVENG 746 Surface Water Quality Modelling |
ENVENG 746 Assignment Details
Report
The mid-semester report provides a comprehensive progress update, documenting work completed and outlining the path to project completion. The report should include:
- Title: A concise description of the study’s focus.
- Abstract: A summary of the project’s scope, progress, and objectives (150-200 words).
- Table of Contents: An organised outline for easy navigation.
- Introduction: Background information, water quality context, and significance of the study.
- Site Description and Data: Details about the study area and data sources, and available measurements.
- Project Goals and Objectives: Clear articulation of what the project aims to achieve.
- Proposed Methodology:
• Model conceptualisation and structure
• Governing equations and process descriptions
• Parameter values and literature ranges
• Validation approach
• Planned sensitivity analyses - Assessment of Progress to Date:
Summary of accomplishments, preliminary results, and challenges so far. - Next Steps: Tasks required for project completion.
- Timeline to Project Completion:
A detailed schedule with deadlines for each milestone. - References:A list of all cited sources.
Presentation
Record and submit a video presentation (MP4 format) that provides a high-level overview of your project. Prepare visual aids using PowerPoint, Prezi, Canva, or similar software. The presentation should cover:
- Project topic and water quality significance
- Research question and objectives
- Methodological approach (model structure and key processes)
- Progress summary and preliminary findings
- Insights gained from work completed
- Remaining tasks and anticipated outcomes
Make your University of Auckland assignments simple with expert writing help
Hire NZ Native Experts 24/7.
ENVENG 746 Project
COMPUTATIONAL MODELLING & DESIGN OF DAIRY PLANT STORAGE POND
1. Project Overview
A dairy processing plant generates wastewater that is either discharged to a nearby river or reused for land irrigation. To comply with increasingly restrictive limits on river water use, the company plans to construct a storage pond (75,000-100,000 m³) to store effluent over winter for reuse during the summer irrigation period. This approach reduces the plant’s reliance on river water while allowing seasonal management of wastewater. While maximising storage is preferred, controlled discharge to the river is permitted under specific conditions to prevent pond overflows.
Your task is to develop a STELLA systems-dynamics model to:
- Determine an appropriate pond size, and
- Simulate pond water storage, biochemical oxygen demand (BOD), and dissolved oxygen (DO) over a full year.
The mid-term and final project reports and presentations collectively account for 65% of the final course grade.
Important note: All students are expected to model pond volume, BOD, and dissolved oxygen (DO). Modelling additional processes (such as nutrients, pathogens, or algae) is optional and intended as an extension. Successful inclusion of additional processes may attract higher marks, provided the core model is robust and well-explained. However, a high-quality core model (volume, BOD, DO) is sufficient to achieve a high mark. Priority should be given to building, validating, and interpreting the core model before attempting extensions
2. Background Information
A. Effluent Characteristics
The factory produces two effluent streams, low-strength and high-strength, which will be combined and stored in the pond (Figure 1). The characteristics of these streams are summarised in Table 1.
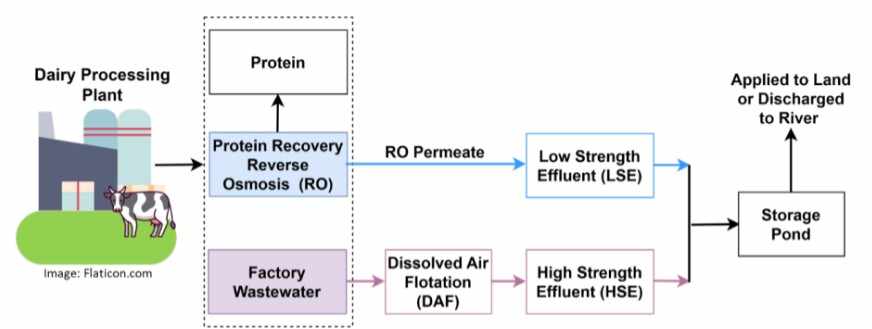
Figure 1: Storage Pond for the two Dairy Plant Effluent Streams
Table 1: Average Effluent Characteristics for BOD and Flow
| Parameter | Low Strength Effluent (LSE) | High Strength Effluent (HSE) | Units |
|---|---|---|---|
| BOD₅ | 26 | 470 | g/m³ |
| Dairy Effluent | Variable (see data file) | Variable (see data file) | m³/day |
Note: For students modelling parameters such as nutrients, algae, or pathogens, additional information is provided in the Appendix.
B. Pond Operation
(i) Winter – Storage Period (May to October)
- Discharge from the pond to the river is allowed in any month when the river’s average flow for that month is at least 80 m³/s.
- A maximum of 6,000 m³/day can be discharged from the pond to the river.
- The maximum permitted daily BOD load to the river is 60 × Q (kg/day), where Q is the river flow in m³/s. (Note: For students also modelling other process variables, the constraints on discharges to the river for these are included in the Appendix.)
- To maximise pond capacity, it should be empty at the start of May.
(ii) Summer – Irrigation Period (November to April)
- No discharge from the pond to the river is permitted.
- All stored effluent must be applied to land. Make appropriate assumptions for the rate of effluent application to land. For example, you can assume a uniform irrigation rate equal to the water storage volume divided by the number of summer days.
3. Modelling The Volume And Water Quality Of Stored Water
A. Pond Design Specifications
- Volume: Choose between 75,000 and 100,000 m³ based on your analysis.
- Base dimensions: Maximum 100 m × 200 m (for simplification, assume the pond has a uniform rectangular cross-section).
- Maximum depth: Keep the water depth in the pond to be less than 6 m.
- Assume: Constant temperatures of 12°C during winter and 20°C during summer. Also, ignore the effect of rainfall and pond evaporation on water storage.
B. Steps to Building the Model
Step 1 – Representative Year Flow Data:
The purpose of Step 1 is to generate reasonable inputs for dynamic modelling, not to optimise statistical accuracy. Use the river, low-strength effluent (LSE), and high-strength effluent (HSE) flow data provided in the spreadsheet to construct a representative year of daily inflows to the pond and corresponding river flows used to determine allowable pond discharge. A simple and defensible approach is sufficient. For example, you may construct representative daily values using calendar-day medians or means derived from the available data. The dataset contains missing values (empty cells). You may deal with these in a reasonable manner, such as:
o ignoring those days, or
o replacing missing values with the most recently recorded value.
Clearly state and justify the approach you adopt. The objective of this step is to produce a reasonable and transparent set of model inputs rather than a statistically optimal dataset.
Step 2 – STELLA Modelling of the Storage Pond:
Construct a STELLA model for the pond that includes the following processes.
o Inflow: Daily LSE and HSE flows with their BOD concentrations.
o Outflow: Discharge to the river (when permitted).
o Volume: Simulate pond volume over time. Your mass balance model will calculate the change in pond storage as ΔVolume = (Inflow – Outflow)Δt.
o BOD Decay: Assume that the biological degradation of organic matter occurs via first-order decay. The BOD mass balance equation can be written as ΔMass_BOD accumulation = (Mass_BOD inflow – Mass_BOD outflow – Mass_BOD Decay)Δt, where the BOD decay rate = k_d × BOD. Typical k_d range is 0.1 – 0.3 (/day) at 20°C.
o Dissolved Oxygen Levels: Model dissolved oxygen in the pond using a simplified mass-balance approach, assuming:
– first-order reaeration from the atmosphere, and
– oxygen consumption proportional to BOD decay.
More detailed or alternative formulations may be used, but must be clearly justified and explained. You may assume the pond is completely mixed and ignore vertical stratification. Evaluate the potential for odour generation, for example, when the DO concentration falls below 2 mg/L. Exploring mitigation strategies (such as mechanical aeration to increase the reaeration rate) may attract additional marks, provided the approach is physically reasonable and clearly explained.
o For students modelling other process variables: Students constructing a more advanced model can include the effect of temperature and the use of an aeration device on BOD and oxygen levels in the storage pond, and the changes in other process variables, such as algae, nitrogen (organic nitrogen, ammonia, nitrite, and nitrate), phosphorus, and pathogens. I am providing the following guidance to enable students to decide which additional processes to model.
| Extension | Complexity | Data Provided | Recommended for |
|---|---|---|---|
| Temperature effects | Low | Yes | Most students |
| Aeration | Medium | Partial | Strong modellers |
| Nutrients | High | Yes | Advanced students |
| Pathogens | High | Yes | Very advanced |
Step 3 – Discharge and Storage Simulation:
Simulate the pond water storage and BOD concentration over a full year, from the start of May to the end of April of the following year. Use the operating conditions described in Sections 2B(i) (winter) and 2B(ii) (summer) to determine when discharge to the river is permitted and to specify discharge rates. Because the pond BOD concentration is not known at the start of the simulation, begin by adopting a conservative initial estimate (for example, assuming the pond BOD equals the inflowing high-strength effluent BOD). Use this estimate to set an initial discharge rule and run the STELLA simulation. Based on the simulated pond BOD, revise the discharge assumptions as needed and rerun the simulation. A pseudo-workflow for the above iterative procedure is:
Initial BOD assumption → run model → check constraints → revise → final scenario.
This iterative process reflects real-world operational practice, where discharge limits and operating rules are adjusted in response to observed system performance. Students modelling additional process variables must also verify that all applicable mass-discharge constraints to the river are satisfied.
Step 4 – Perform Sensitivity Analysis:
Assess the effects of variation in k_d and plant effluent flow rates on pond volume and water quality by simulating the following scenarios.
o Effect of BOD decay rate (k_d) on Pond BOD: Assess how a 25% increase and decrease in k_d affects the BOD concentration in the pond discharge. Assume the pond discharge rates remain unchanged.
o Effect of future increase in plant capacity: Evaluate how a 20% increase in both HSE and LSE flows affects pond performance; determine the increase in required pond volume.
o Other process variables: Where applicable, develop criteria to assess the effect of variations in these processes on the pond’s water quality and discharge to the river.
Note: The sensitivity analysis is exploratory rather than statistical. Two scenarios are sufficient unless additional processes are modelled. No Monte Carlo methods are expected. The depth of interpretation is more important than the number of scenarios tested.
Model Outputs:
The key outputs are pond volume (m³), flow discharged to the river (m³/day), and BOD and DO in the pond (g/m³) over a full year (March-April the following year). Specify the dimensions of the storage pond (ensure your pond complies with a maximum depth specification of 6 m). (Students modelling additional processes will need to include relevant details.)
4. Deliverables
A. Project Report (max. 10 pages single-spaced text, excluding figures, tables, and appendix)
Student reports should contain the following elements:
- Your Name and ID Number (No marks): Your report will not be marked without these details.
- Title (No marks): A concise description of the project’s focus.
- Abstract (15 marks): A concise summary of the project, covering the background, objectives, methods, key findings, and the significance of those findings.
Finish your ENVENG 746 assignment on time with expert assistance
Pay to NZ Native Writers | Cheap Cost & Plag Free
Finding your ENVENG 746 Surface Water Quality Modelling assignment difficult to handle? Many students struggle with building STELLA models, understanding BOD and DO calculations, and applying real data to simulations properly. If you’re also confused or short on time, you can go with NZ Assignment Help, where our experts provide accurate engineering assignment help based on your course requirements. You can also check our UOA assignment examples to see how technical reports are structured. Choose our assignment help auckland and get a fully customised solution prepared only for your assignment.

- MKTG801 Marketing and Enterprise Assignment 4 , 2026 | Auckland Institute Of Studies
- 722.726 Pacific Health and Wellness Assessment Brief 2026 | MIT New Zealand
- BIT501 Business Concepts and Communication Assessment 1, 2026 | Open Polytechnic
- BSNS5004 Change and Innovation Assessment 1 , 2026 | Open Polytechnic
- NURS5119 Introduction to Te Ao Maori and Pacific Peoples in Aotearoa Summative Written Assignment 2, 2026 | Whitireia & WelTec
- OPSMGT 357 Project Management Individual Assignment – Semester 1 2026 | UOA
- BSNS5003 Business Functions Assessment 1 , 2026 | Open Polytechnic
- BSNS5002 Business Environments Assessment 1, 2026 | Open Polytechnic
- 32405 Write Texts to Communicate Ideas and Information Assessment 2026 | NZQA
- 32403 Demonstrate Understanding of Ideas and Information in Written Texts Assessment 2026 | NZQA